
Nsight Systems and Nsight Compute: explain GPU stalls without misreading the counters
Move from application timelines to targeted kernel counters, accounting for replay, cache state, occupancy and shared-resource effects before changing CUDA code.
A kernel can become faster while the training step barely changes. It may contribute little to elapsed time, or the change may expose a host, communication or storage delay that the original analysis never measured.
Start with the application timeline and choose a meaningful interval. Then collect counters for a specific kernel invocation. Nsight Systems and Nsight Compute answer different parts of that investigation, and the measurement conditions need to travel with their reports.
Find where elapsed time is actually spent
Measure the application without profiling first. Record input, iteration count, warm-up policy and the output used to verify correctness. Retain both end-to-end time and a representative steady-state interval.
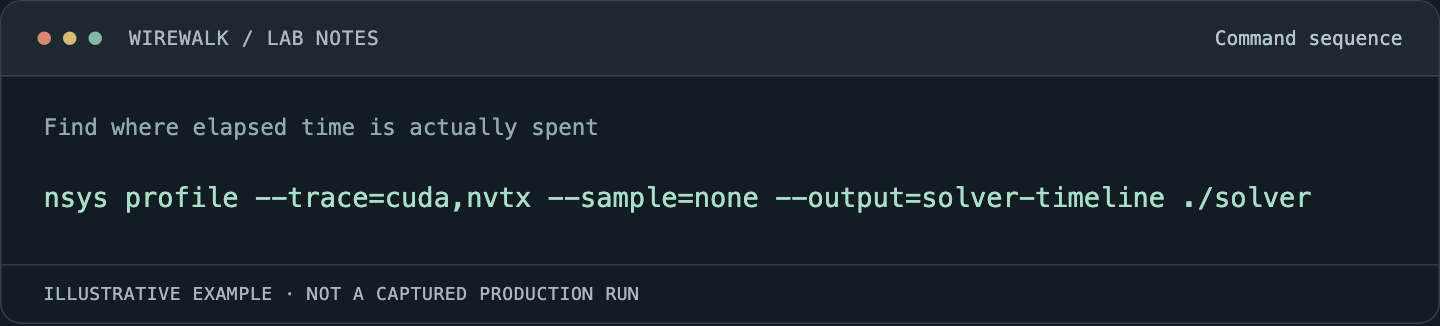
Nsight Systems provides the execution timeline needed to locate host gaps, CUDA activity, transfers and supported annotations. A bounded example is:
Read and copy the example as text
nsys profile --trace=cuda,nvtx --sample=none --output=solver-timeline ./solver
This example omits CPU sampling to keep the initial collection focused. Adapt the trace configuration and duration to the installed release. A full production run can produce excessive data and substantial overhead; a selected reproducing interval is usually more useful.
Add NVTX ranges around meaningful application phases when source changes are possible. Label work by its role in the experiment rather than giving every tiny function a range. The objective is to connect a slow step to the activity that delayed it.
Distinguish waiting on the host from slow execution on the device
Look for periods when the GPU lacks work and for periods when work is present but completion is slow. Host-side API duration, queued GPU work and device execution duration are different measurements. A long synchronization call can simply be the place the host waits for earlier work.
Inspect transfer overlap and stream dependencies. Confirm whether the application actually offers independent work before concluding that a scheduling mechanism failed to overlap it. A serial producer cannot be repaired by raising a GPU utilization target.
For multi-rank applications, compare timelines from the relevant ranks with synchronized context and explicit clock assumptions. One late rank can turn collective time into the visible symptom of a CPU or data-loading delay elsewhere.
Select one invocation before collecting many counters
Use the timeline to identify the important kernel, its input scale and whether it occurs during warm-up or steady state. Collect a small initial metric set with Nsight Compute, then expand only when a specific hypothesis requires it.
An illustrative collection is:
ncu --set basic --launch-count 1 --export kernel-pass ./solver
This selects one launch according to the tool’s current selection rules; it does not know which launch matters to the research workload. Use the installed version’s kernel filters, launch selection or range facilities to target the invocation identified in the timeline. Save those settings with the result.
The Nsight Compute profiling guide explains why collection may require replay. A profiled invocation can execute under conditions that differ from normal concurrent application execution.
Preserve replay and cache policy in comparisons
Hardware counters cannot all necessarily be collected in one pass. Replay and the associated cache handling affect what a reported access pattern means. Record the replay mode, cache-control setting, metric selection and clock behavior.
A warm cache in the ordinary application and a flushed cache in profiling can produce different results without either measurement being defective. Decide which experiment you need. If the hypothesis concerns inter-kernel reuse, use a supported collection method that preserves the relevant context and validate it against the uninstrumented timeline.
Do not compare a cache-hit ratio from one replay policy with a bandwidth figure from another and present the combination as a single observed execution. Keep related measurements in a coherent collection configuration, with limitations stated.
Interpret cache behavior through traffic and useful work
A low cache-hit rate can be expected for a streaming workload. A high hit rate can coexist with a slow kernel if dependencies, instruction throughput or synchronization dominate. Ask how much data is transferred for each useful output and which level serves it.
Examine access layout and request efficiency before proposing a larger cache as the remedy. Uncoalesced accesses or unnecessary intermediate arrays can increase traffic independently of dataset size. A cache optimization that reduces traffic but increases instructions or register demand needs an end-to-end check.
Use the relevant CUDA best-practices guidance for the target architecture. Avoid carrying one GPU’s metric names or memory hierarchy assumptions into another generation without review.
Treat occupancy as a constraint, not a score
Occupancy describes the residency of active warps relative to supported capacity under specified conditions. It does not directly measure useful issue rate, instruction efficiency or application throughput. Increasing it can help hide latency, but can also change register pressure, shared-memory use and spilling.
Inspect why residency is limited and whether the kernel has enough independent work to benefit. Reducing registers merely to improve an occupancy number may create extra local-memory traffic. Compare the changed kernel’s actual duration and correctness with its original behavior.
Similarly, a stall category identifies an observation in the processor’s execution machinery. It is a lead for investigation, not a source-code fix by itself. Connect it to the hot instruction sequence, data dependency or synchronization pattern before rewriting the algorithm.
Revalidate outside the profiler
Run the original and changed application under matched allocation, placement and software conditions. Alternate selected runs to expose warming and background-load effects. Report variation rather than just the best time.
Measure a neighboring workload where shared GPUs or other shared resources are part of the service. A kernel improvement that consumes more memory bandwidth can change another user’s latency even if its own execution improves.
Keep a compact analysis record: application phase, selected invocation, profiler settings, supporting counters, proposed cause, code change and unprofiled outcome. For the correctness checks that precede this process, see CUDA-GDB and Compute Sanitizer. Hardware analysis becomes useful when it explains the application’s behavior under its real operating conditions.