
Debugging CUDA failures with CUDA-GDB and Compute Sanitizer
Reduce CUDA failures to a reproducible case, separate host and device errors, choose the right sanitizer, and preserve optimized behavior when a debug build hides the fault.
An illegal device access often becomes visible at a later synchronization call. The host stack then points to where the application noticed the problem, which may be far from the kernel that caused it. Editing that last visible line can waste hours while leaving the original defect intact.
A useful CUDA investigation preserves the failing input and execution environment, establishes an observation boundary, and uses the smallest tool that can answer the next question. A debugger helps inspect state. A sanitizer detects particular classes of incorrect behavior. Neither makes a debug build equivalent to the production executable.
Preserve a failure that another person can reproduce
Record the executable and source revision, build flags, CUDA runtime, host driver, GPU identity and input. Include the launcher and container digest where applicable. Keep the ordinary allocation context: a test on an otherwise idle interactive GPU may omit the streams, concurrency or memory pressure involved in the original failure.
Reduce input size and iteration count gradually, confirming that the failure still occurs after each reduction. Save the last reproducing case. If the problem depends on a particular batch size or ordering, that dependency is part of the evidence rather than an inconvenience to remove.
Check CUDA API return values and kernel-launch errors in the application. Establish where asynchronous errors are first observed. A temporary synchronization boundary can help localize a failure, but it changes execution timing and should be labeled as a diagnostic modification.
Keep host and device debugging builds separate
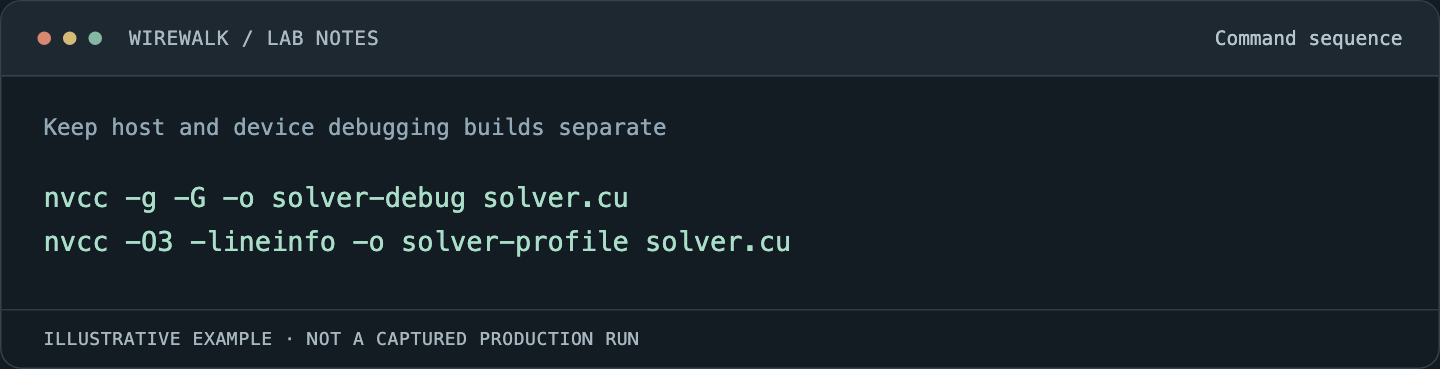
NVIDIA’s CUDA-GDB 12.8 guide describes debugging information and device execution controls. A small illustrative build pair is:
Read and copy the example as text
nvcc -g -G -o solver-debug solver.cu
nvcc -O3 -lineinfo -o solver-profile solver.cu
The source and executable names are placeholders. Preserve the real program’s required architecture, include and link options. -G enables device debugging and can substantially change generated code and optimization behavior. Line information in an optimized build helps attribution but does not provide the same variable visibility as a device-debug build.
Give the variants different paths and retain their identities with reports. A core file or sanitizer log associated with the wrong executable can look like corrupt state even when the real problem is a symbol mismatch.
Choose a sanitizer for the suspected failure
The Compute Sanitizer documentation distinguishes its tools. memcheck addresses device memory-access and related errors; racecheck focuses on shared-memory data hazards; initcheck checks uninitialized device global-memory accesses; synccheck examines supported synchronization misuse.
Use that scope when interpreting a clean run. Shared-memory hazard detection is not a guarantee that every global-memory communication protocol is correct. A synchronization checker is not a general proof that a distributed program cannot deadlock.
For a bounded reproducer, separate runs might use:
compute-sanitizer --tool memcheck --error-exitcode 99 ./solver-debug
compute-sanitizer --tool racecheck --error-exitcode 99 ./solver-debug
compute-sanitizer --tool initcheck --error-exitcode 99 ./solver-debug
compute-sanitizer --tool synccheck --error-exitcode 99 ./solver-debug
Confirm the installed release’s supported features and command options. Start with memory-access failures before building explanations around later corrupted values. Record tool output and the application’s own status; the configured exit code makes detected errors easier to distinguish in an automated test.
Inspect the right GPU execution context
Launch the reproducer under cuda-gdb and stop near the suspected operation. Identify the active kernel and relevant device threads rather than assuming that the debugger’s current host thread represents the device failure.
A basic interactive session can start with:
(cuda-gdb) break main
(cuda-gdb) run
(cuda-gdb) info cuda kernels
(cuda-gdb) info cuda threads
Inspect the release’s CUDA-specific focus controls before selecting a block, warp or lane. A value printed from one execution context does not describe every thread. Examine the address calculation, bounds and launch dimensions for the failing context, then compare them with a context that behaves correctly.
Avoid printing a large device buffer indiscriminately. It can slow the session and expose research data in logs. Retain only the state needed to explain the defect, with the full reproducer stored through the team’s normal protected workflow.
Investigate failures that disappear under instrumentation
Sanitizers, breakpoints and debug compilation alter timing. A race can disappear because accesses are delayed or serialized; an out-of-bounds write can land differently after allocation layout changes. Success under a debugger is therefore a change in observed behavior, not closure.
Compare optimized builds with and without the diagnostic changes. Keep input, launch geometry and resource requests fixed where possible. Look for missing synchronization, premature buffer reuse, incorrect stream dependencies and lifetime errors at host/device boundaries.
Add a targeted invariant that checks the suspected contract, such as a valid index range or completion before reuse. The check should fail near the cause and produce enough context to distinguish attempts. Remove broad synchronization added solely for localization once the actual dependency is corrected, then retest.
Separate a software defect from a hardware incident
A device exception alone does not prove faulty hardware. Correlate reproducibility with application input, GPU identity, driver state and relevant system error records. A known-good workload on the same device and the reproducer on another qualified device can help narrow the explanation.
Keep those comparisons controlled. Moving to another node often changes the GPU, driver, container environment and neighboring load at once. If the result changes, identify which variables differ before assigning the cause to a card.
Where hardware health evidence warrants maintenance, preserve it and use the approved node-isolation process. Do not reset a GPU serving other jobs as an application-debugging shortcut.
Close with optimized correctness and ordinary execution
Retain the reproducer as a regression test with an expected result. Re-run the relevant sanitizer, then execute the optimized program through the normal scheduler and container path. Confirm numerical or structural output correctness, cleanup and the behavior of the original input.
Measure performance again without the debugger or sanitizer. A fix that adds an accidental device-wide synchronization may be correct but carry a material cost. Explain that cost or replace the broad synchronization with the required dependency.
For a device that is correct but slow, continue with Nsight timeline and kernel analysis. That investigation starts from a working result rather than trying to optimize corrupted computation.