
AMD GPU debugging and hardware analysis with ROCgdb, rocprofv3 and ROCm Compute Profiler
Build an AMD GPU investigation from a HIP reproducer to wavefront debugging, timeline tracing and architecture-specific cache and compute analysis, then verify the result outside the tools.
A HIP application can be slow because the host launches work late, the GPU spends time moving data, a kernel issues inefficient accesses or a correctness defect causes retries and abnormal execution. These cases can all produce an unhelpful description: the GPU is not performing well.
Build the investigation in stages. Preserve a reproducer, establish correctness, inspect the application timeline, then collect targeted hardware evidence. ROCgdb, rocprofv3 and ROCm Compute Profiler have complementary roles; their reports should remain tied to the software version and AMD GPU architecture that produced them.
This workflow uses documented ROCm 6.4-era facilities as a baseline. It does not assume that every later profiling feature, accelerator family or device-debug capability is available in that release.
Capture the actual host and device environment
Record the GPU architecture and identity, kernel driver, ROCm runtime, compiler, communication libraries and application build. Include the container and launch command when those participate in the workload.
Check support for the exact device, operating system and tool combination. A runtime that can execute a program does not automatically establish support for every debugger or hardware-counter feature. Device access and profiling permissions also depend on the host’s configuration, even when the tools are installed in a container.
Reduce the input while preserving the failing or slow behavior. Keep an output check so a performance experiment cannot silently compare different computations. For floating-point work, define an appropriate correctness criterion rather than assuming byte-identical results are always required.
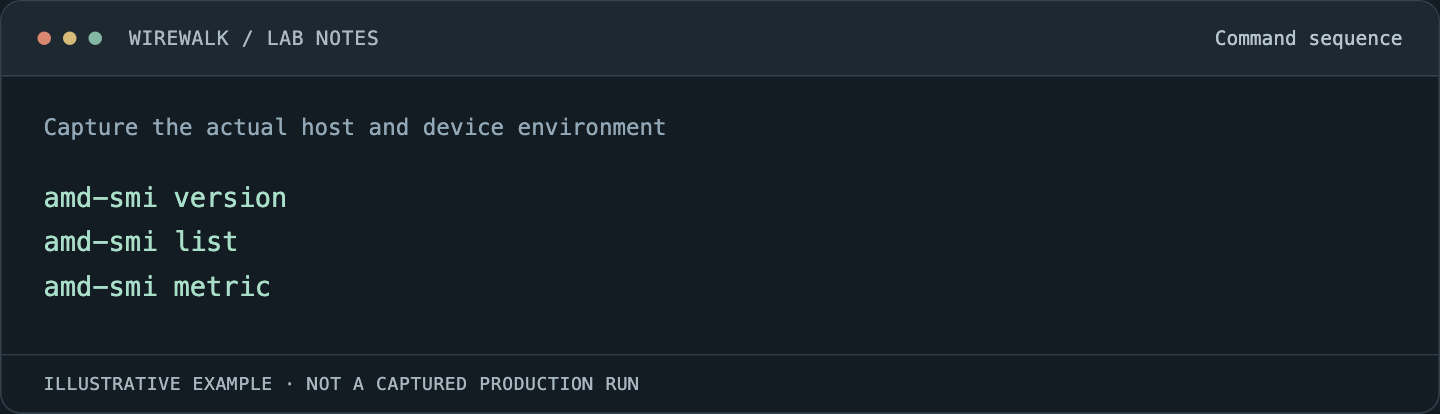
Use the supported AMD SMI telemetry interface to retain device identity and operating context before and during the experiment. Basic read-only snapshots can start with:
Read and copy the example as text
amd-smi version
amd-smi list
amd-smi metric
Available fields depend on the platform. Align clock, power, temperature and activity observations with the application interval. These readings can expose an operating constraint, but do not identify which kernel instruction or cache access caused a stall. Avoid mixing a whole-device activity percentage with a per-kernel counter as though they had the same scope.
Debug a small HIP case before profiling it
The ROCgdb 6.4 quick start describes building with debug information and using host and device views. An illustrative setup is:
hipcc -g -O0 -o hip-debug solver.cpp
rocgdb ./hip-debug
Keep the application’s required target and link flags in the real build. A separate optimized executable should preserve the original behavior for later validation.
Set a breakpoint in a meaningful host or kernel source location, run the reproducer and inspect its context. Device threads in ROCgdb represent wavefronts rather than a list of independent HIP work items. Select the relevant wavefront and lane context using the documented controls before interpreting variables or registers.
Inspect address calculations, bounds, lifetime and synchronization. A host stack at a synchronization call may be observing an earlier device failure. Adding synchronization can help localize the interval, but changes timing and should remain a clearly identified diagnostic modification.
Keep debugging effects separate from the remedy
A bug disappearing at -O0 or under a breakpoint does not establish that the optimized code is correct. Instrumentation and changed code generation alter scheduling, allocation and timing.
Preserve the original optimized case and add a targeted check around the suspected contract. If the cause is premature reuse, identify which completion dependency protects the buffer. If the cause is an invalid index, connect the failing work item to its input and launch geometry.
Read the versioned AMD GPU debugging limitations before promising support for a particular architecture or execution feature. Do not bypass host security policy or expose all devices in a shared environment merely to get the debugger to attach.
Trace the application before selecting counters
The ROCprofiler-SDK 6.4 rocprofv3 guide documents separate tracing choices. A bounded example is:
rocprofv3 --hip-trace --kernel-trace --memory-copy-trace \
  --output-format csv -- ./hip-solver
The application is a placeholder. Limit the reproducer’s duration and keep output paths unique between attempts. The command is intended to expose API, kernel and copy timing; it is not a complete hardware-counter analysis.
Inspect launch gaps, data transfers and kernel execution over the same application phase. Use supported markers when source instrumentation can provide useful phase names. A long host API call and a long kernel are different observations and should not be merged into a generic GPU wait total.
Narrow hardware collection to a meaningful kernel
Choose the kernel and invocation from the trace, including its problem size and warm-up state. Then use the installed version’s supported counter collection or ROCm Compute Profiler workflow for that device.
ROCm Compute Profiler’s versioned profile guide describes counter collection and analysis capabilities. Confirm architecture support and replay behavior before using a predefined analysis. A report with a familiar panel name does not guarantee equivalent hardware events across GPU generations.
Multiple passes can change timing and cache context. Record the collection method, selection filters and number of passes where available. Do not claim that a serialized or replayed measurement preserves all overlap and contention from normal concurrent execution.
Read cache, LDS and compute observations together
Distinguish global-memory traffic, cache activity, Local Data Share usage and register-related constraints. LDS is a different resource from a hardware-managed cache. An optimization that moves data into LDS changes explicit storage and synchronization requirements as well as access latency.
A cache-hit ratio needs its request population and hierarchy level. High hit rates can coexist with inefficient request patterns; low rates can be normal for streaming data. Compare bytes moved and useful output, with architecture-specific definitions retained.
Inspect wavefront residency and register demand without treating maximum occupancy as the objective. Extra resident work can hide latency, while a change that forces spilling or increases synchronization can make the kernel slower. Use a supported roofline analysis only when the operation count, traffic definition and relevant ceilings are understood.
Re-run the full application under ordinary conditions
After a code or layout change, check correctness and measure the uninstrumented executable using matched input, placement and allocation. Alternate selected comparisons to expose warm-up and background variation.
For distributed workloads, repeat the communication path and examine whether a faster local kernel changes collective waiting or transfer overlap. A single-device result does not establish an improvement for the whole job.
Save the reproducer, tool versions, device architecture, report configuration, proposed cause and final application outcome. For the CPU side of a heterogeneous pipeline, see AMD uProf and IBS analysis. A useful hardware report explains where the application spends time and which controlled change improved its work.