
AMD CPU analysis with uProf and IBS: follow the data across cores and cache domains
Investigate AMD CPU performance using topology, uProf event sampling and IBS, with explicit distinctions between core activity, cache domains, memory locality and data-fabric traffic.
Two thread-placement policies can use the same number of AMD CPU cores and produce different application times. The difference may come from shared-cache locality, memory placement, synchronization or the distribution of work across the processor’s topology.
Before changing BIOS settings or adding threads, map the resources the application uses and identify the phase that is slow. AMD uProf and Instruction-Based Sampling can help connect that phase to execution and memory behavior, provided the observations are interpreted for the installed processor and tool release.
Map the topology the operating system exposes
Record the CPU family and model, core and SMT layout, NUMA domains, relevant firmware policy and the scheduler’s allowed CPU set. Do not use a processor’s marketing core count as the placement map for a job.
Inspect the cache-sharing information the kernel exposes. A small read-only inventory can include:
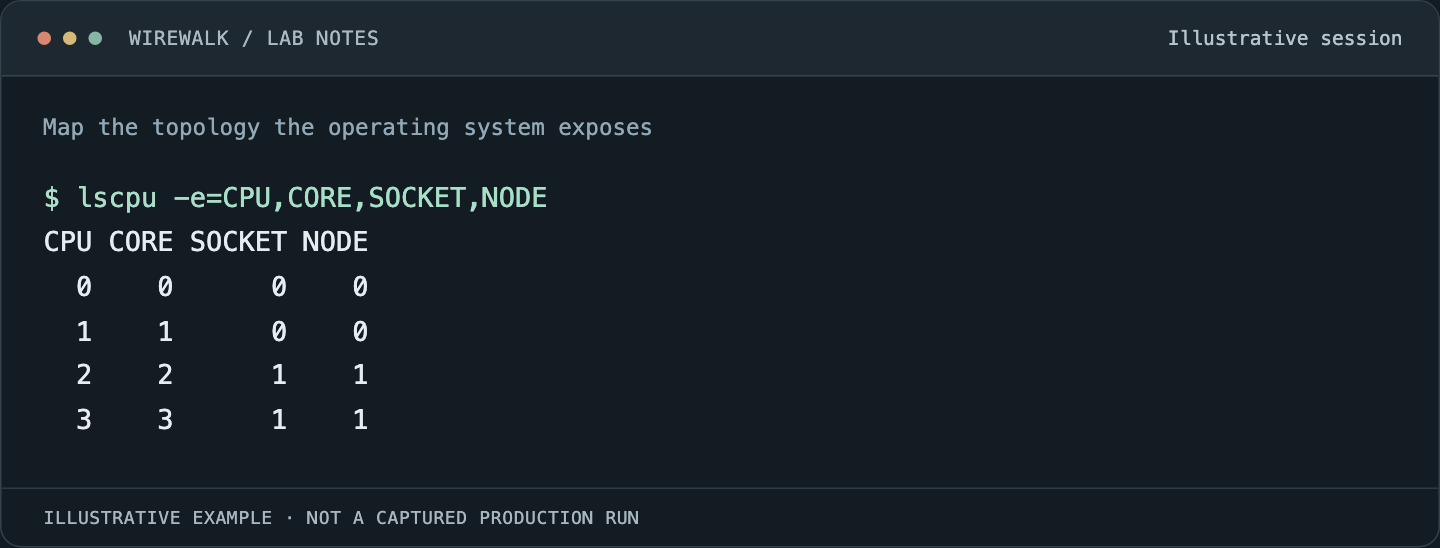
Read the illustrated session as text
$ lscpu -e=CPU,CORE,SOCKET,NODE
CPU CORE SOCKET NODE
  0    0      0    0
  1    1      0    0
  2    2      1    1
  3    3      1    1
Read and copy the original commands
lscpu -e=CPU,CORE,SOCKET,NODE
numactl --hardware
for cache_dir in /sys/devices/system/cpu/cpu0/cache/index*; do
  printf '%s\n' "$cache_dir"
  cat "$cache_dir/level" "$cache_dir/type" "$cache_dir/size" \
      "$cache_dir/shared_cpu_list"
done
The cache view here begins with CPU 0. Inspect representative CPUs from other relevant groups before drawing a system-wide map. A cache domain and a NUMA node describe different relationships and should not be assumed to have identical membership.
Keep firmware topology changes out of the initial experiment. If changing a supported NUMA-per-socket policy becomes justified, it is a separate maintenance operation with its own reboot and placement qualification.
Establish where threads spend time
Start with elapsed time, correctness and a small representative input. Record the phase boundaries and the expected amount of useful work. A busy core might be computing, spinning or repeatedly retrying a failed operation.
Use a supported uProf sampling configuration to identify hot functions and threads before requesting large hardware-event sets. Preserve symbols for the actual optimized executable and make the source mapping reproducible. Debug and optimized binaries can have different hot paths and memory access patterns.
A low-overhead baseline and a more detailed collection are separate observations. Compare their elapsed times to estimate whether instrumentation materially changes the behavior under investigation. Do not treat a sampled profile’s total duration as the uninstrumented application result.
Keep core PMCs, IBS and fabric observations distinct
AMD’s uProf hardware-source documentation distinguishes hardware sources including core performance counters, IBS and data-fabric counters on supported processors. They provide different views of execution.
Core counters measure selected events within their supported scope. IBS samples information associated with instruction fetch or execution operations, with model-dependent fields and filtering. Data-fabric observations cover resources beyond one core and may include activity from other work.
Use the installed tool’s supported profile and event definitions for the exact processor. An event encoding or derived metric from one Zen generation should not be copied into another generation’s report without checking its meaning and availability.
Retain tool and event-definition versions with the results. A friendly label in a report is not enough to reconstruct what was counted or sampled.
For interval monitoring on supported AMD processors, AMDuProfPcm provides selected core and memory-system measurements. Preserve its model-specific configuration, sampling interval and processor coverage. Treat platform-level output as shared-system evidence until the experiment establishes which workload produced the activity.
Use IBS to narrow an expensive access pattern
Find the hot code and the relevant load or instruction region, then inspect the supported IBS evidence about its behavior. Keep sample counts and confidence in view. A few expensive samples may identify a lead but are not a reliable distribution of all accesses.
Determine what the tool reports about cache service, locality and latency for the processor in question. Do not invent unavailable fields or convert an unknown source into a local-cache hit. Keep data-source categories and aggregate PMU traffic separate until their relationship is understood.
The older uProf 4.2 guide is a useful historical reference for established IBS capabilities. Current uProf features may be broader; match the interpretation to the version that produced the report.
Test locality with a controlled initialization policy
Memory placement depends on how memory is allocated and touched, not just where the later compute threads run. Record initialization threads, placement policy and whether data is reused across phases.
Compare a qualified local-placement run with another deliberately chosen policy, keeping input and allowed resources fixed. Observe application time, placement evidence and relevant memory traffic. Do not infer remote access merely because threads span sockets; the pages and access pattern must support that explanation.
Use only CPUs and memory resources available to the allocation. A profiling wrapper that overrides scheduler affinity can produce an impressive result while measuring a service users are not actually allowed to run.
Separate shared-cache pressure from communication costs
Vary working-set size while preserving the algorithm and useful work definition. Look for changes in the relationship between elapsed time, supported cache observations and memory traffic. Account for extra initialization and allocation costs as the dataset changes.
Then vary placement across known cache-sharing groups. Keeping cooperating threads close can help some workloads, while separating independent bandwidth-heavy work can help others. The architecture map informs the experiment; it does not choose the winner in advance.
For writable shared data, inspect ownership and layout. A cache line moving between cores can reflect necessary communication or avoidable false sharing. Change one suspected object or partition boundary and verify the result. Adding padding everywhere can increase memory footprint and lose useful locality elsewhere.
Interpret core utilization and frequency carefully
A fully occupied logical CPU does not necessarily perform useful application work. Examine synchronization, imbalance and instruction behavior. Count completed items or iterations alongside CPU time and hardware observations.
Record whether SMT siblings are active and whether the frequency measurement is sampled, requested or otherwise derived. Avoid comparing nominal clock specifications with a workload’s effective execution rate as though they were the same quantity.
If several jobs share a socket, fabric and memory-channel observations may be contaminated by their activity. Prefer an agreed profiling allocation or describe the shared load explicitly. Do not assign the socket’s entire traffic to the one process that happened to be instrumented.
Retain a result another administrator can repeat
The final record should contain the workload, executable, CPU model, topology, allowed placement, profile configuration, supporting observations and the controlled change that tested the explanation. Repeat the application without the profiler and validate output.
For GPU-fed research pipelines, confirm whether the CPU change shortens the actual input or communication stage. A faster CPU microbenchmark is useful evidence about a component; it is not proof that training completed sooner.
Compare this workflow with Intel VTune and PCM analysis. The experimental discipline carries across vendors, while cache topology, event definitions and the interpretation of samples remain specific to the hardware.