
Intel CPU analysis with VTune, PCM and perf: distinguish cache misses from memory stalls
Combine process-level sampling, core counters and socket-level memory observations to investigate Intel CPU performance without assigning every cache miss to DRAM.
A cache-miss count is the start of a question. It does not tell you whether the request reached DRAM, whether another cache supplied the line, or whether the processor overlapped the delay with useful work.
For an Intel CPU investigation, connect the application’s slow phase to core behavior and then to the memory subsystem. VTune can attribute activity to code and threads. Intel Performance Counter Monitor supplies useful platform-level views. Linux perf can provide a compact repeatable measurement when the selected events are supported and permitted.
Inventory the CPU set the application can actually use
Record processor model, stepping, topology, firmware settings relevant to the experiment, kernel and profiler versions. Include the batch allocation and the process’s allowed CPUs. A node with many logical CPUs does not necessarily grant a job access to all of them.
Start with read-only topology observations:
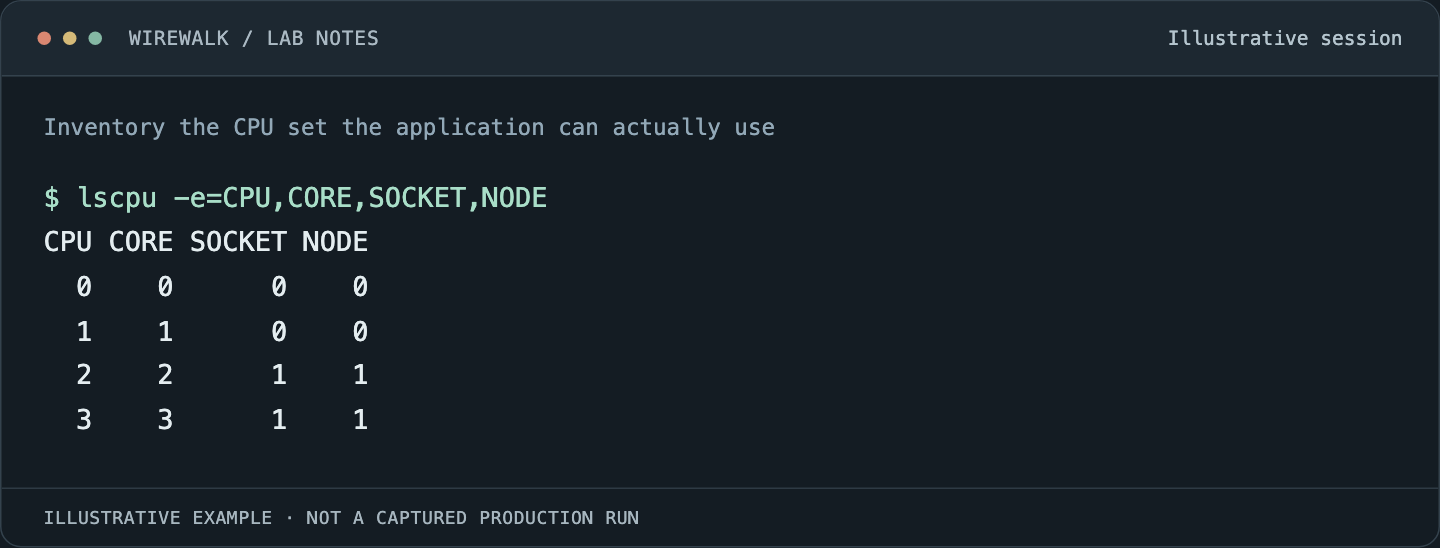
Read the illustrated session as text
$ lscpu -e=CPU,CORE,SOCKET,NODE
CPU CORE SOCKET NODE
  0    0      0    0
  1    1      0    0
  2    2      1    1
  3    3      1    1
Read and copy the original commands
lscpu
lscpu -e=CPU,CORE,SOCKET,NODE
numactl --hardware
Map threads to physical cores, SMT siblings and NUMA domains. Do not infer memory locality from socket count alone. A processor platform can expose several locality domains within a socket, and firmware policy affects the topology presented to the operating system.
Retain dataset size and initialization behavior. Memory placement established by the threads that initialize data can persist into the timed phase, making an apparently identical compute loop behave differently.
Establish a small process-level baseline
Use the uninstrumented application for elapsed time and correctness. Then add a bounded observation such as:
perf list
perf stat -r 3 -e cycles,instructions -- ./solver input.dat
solver and its input are placeholders. The perf stat manual documents event counting and reporting. Confirm event availability, permissions and the scope of each result on the actual system.
Counted instructions and cycles provide context, not a scientific throughput metric. A vector instruction can perform different work from a scalar one, and a more efficient algorithm may retire fewer instructions while taking less time. Keep application output rate beside IPC rather than optimizing the ratio in isolation.
Locate the hot phase before opening every metric
A compact VTune collection can begin with:
vtune -collect hotspots -result-dir vtune-hotspots -- ./solver input.dat
vtune -collect memory-access -result-dir vtune-memory -- ./solver input.dat
Use separate runs and matching inputs. Collection availability, data detail and overhead depend on the target CPU, permissions and installed collectors. The VTune command-line guide describes analysis types and target syntax.
Identify which functions, threads and intervals dominate the phase. Sampling is evidence about observed execution, with attribution limits. A source line receiving samples may be near the expensive operation rather than a complete explanation of why it is expensive.
Distinguish core execution limits from memory limits
Use the supported microarchitecture view to form a hypothesis: front-end delivery, speculation, execution resources, memory latency or bandwidth may be involved. The event formulas and categories depend on processor generation and tool version.
Keep counts with their denominators. If calculating misses per thousand retired instructions, the miss event and instruction count need compatible scope and interval. A socket-wide count divided by one thread’s instructions produces a number with no useful interpretation.
Check whether events were multiplexed, unsupported or scaled. Collecting too many events can reduce how long each is observed. Repeat a narrower set when the result is central to the conclusion, especially if activity varies across phases.
Use uncore observations to test the memory explanation
Intel PCM includes tools such as pcm-memory and pcm-numa for supported platforms. These can help examine memory-channel traffic and locality-related behavior beyond one process’s sampled hot lines.
Keep platform scope explicit. A socket’s memory traffic includes other work, operating-system activity and potentially other users. Collect during an isolated maintenance allocation where possible, or retain enough context to describe the contamination.
Avoid running competing counter tools simultaneously without reviewing their interaction. PMU ownership and collection mechanisms can conflict or reduce available measurements. Coordinate the experiment through the site’s normal profiling policy instead of weakening machine-wide access controls to make every tool run.
Separate locality, bandwidth and sharing
Use a controlled comparison rather than diagnosing all three from a single miss ratio:
| Hypothesis | Focused experiment | Evidence to retain |
|---|---|---|
| Remote placement hurts latency | Compare supported local and remote placement with the same CPU set and initialization policy | Application time, placement evidence, locality and traffic observations |
| Memory bandwidth is saturated | Vary active cores while keeping the useful work comparable | Output rate, memory traffic, per-thread behavior and variation |
| Threads contend on cache lines | Change layout or ownership of the suspected shared objects | Correctness, line-sharing evidence, coherence-related observations and elapsed time |
Keep each experiment within the assigned resources. A lower thread count can reduce both bandwidth demand and synchronization, so success at that setting does not identify the cause without supporting evidence.
Prove false sharing rather than inferring it from proximity
Two threads updating independent values on the same cache line can create coherence traffic. That is different from necessary communication through a genuinely shared value. Find which threads write which locations and inspect the actual object layout.
Intel’s false-sharing example illustrates the kind of attribution required. Its measured speedups belong to that example, not to an arbitrary research code. Padding or partitioning is an experiment whose additional footprint and locality effects must also be measured.
A reduction in a coherence-related event is useful, but accept the change only after the application remains correct and completes the intended work faster or with a documented resource benefit.
Finish with a model-specific conclusion
Save the CPU model, event definitions, scope, collection configuration, workload phase and placement with the report. Explain which observation supported the cause and which controlled change tested it.
Repeat the uninstrumented workload and a representative larger case. A cache optimization that helps a tiny working set may lose its advantage when data grows or another rank shares the socket.
For the equivalent analysis boundaries on AMD systems, see AMD CPU core, cache and IBS analysis. Comparable research questions do not make vendor PMU events interchangeable.