
Debugging Intel-compiled C++ and Fortran without losing the optimized failure
Build a reproducible Intel compiler investigation with matching symbols, explicit optimization levels, Intel Distribution for GDB and controlled thread and runtime settings.
A numerical application that works at -O0 and fails at -O2 has supplied an important clue, but not a diagnosis. Optimization can expose undefined behavior, change floating-point evaluation, move instructions or remove variables that a debugger would otherwise display.
Keep the optimized failure reproducible while building a second executable that is easier to inspect. The investigation should connect the two rather than gradually changing flags until the problem disappears and calling that combination a fix.
This article uses Linux, the Intel oneAPI C++ and Fortran compilers, and Intel Distribution for GDB. Older Intel compiler and debugger product names should not be treated as interchangeable with the installed icpx, ifx and gdb-oneapi tools.
Preserve the executable, libraries and input together
Record compiler and linker versions, full build flags, source revision and input. Retain the module environment and resolved runtime libraries. An MPI wrapper can add flags and libraries that are absent from a command copied out of a build log.
Keep the failing executable and its debug information. A rebuilt file with the same name is not necessarily the same binary. If a core file is available, preserve the matching executable and shared libraries or a reproducible image that contains them.
Separate a crash, a hang and a numerical mismatch. They need different evidence. For a mismatch, define the accepted numerical tolerance and preserve reference outputs; a program that simply reaches normal exit has not passed that test.
Make optimization an explicit variable
An illustrative CPU build pair is:
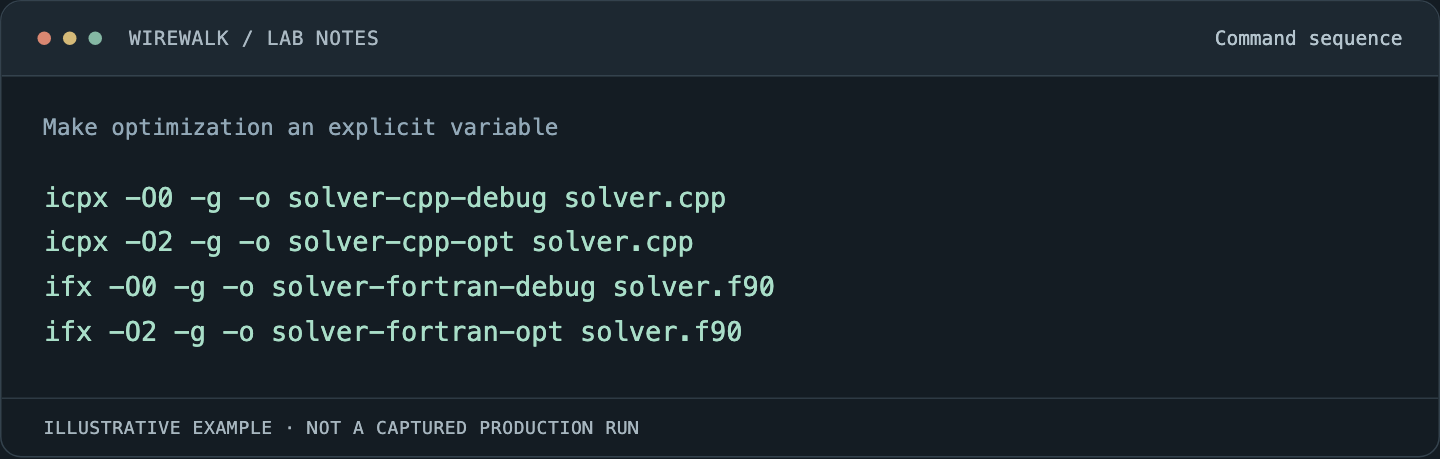
Read and copy the example as text
icpx -O0 -g -o solver-cpp-debug solver.cpp
icpx -O2 -g -o solver-cpp-opt solver.cpp
ifx -O0 -g -o solver-fortran-debug solver.f90
ifx -O2 -g -o solver-fortran-opt solver.f90
These commands omit the application’s required build and link options. Preserve MPI, OpenMP, include paths and library choices in the real build. Use separate output paths so a later command cannot silently replace the executable associated with the evidence.
Intel’s discussion of optimization and debugging explains the trade-off between transformed code and source-level visibility. Specify both -g and the intended optimization level; do not assume that asking for debug information preserves every other compiler default.
For a large project, consider narrowing diagnostic changes to a translation unit after confirming that the failure survives. Changing the entire executable at once may alter timing and memory layout so much that the useful symptom vanishes.
Establish an ordinary host-debugging session first
Use the installed tool environment and launch the small reproducer:
gdb-oneapi ./solver-cpp-debug
For a native host program, familiar GDB operations provide a useful starting point:
(gdb) set pagination off
(gdb) break main
(gdb) run
(gdb) info threads
(gdb) thread apply all bt
Choose a real source or procedure breakpoint for the Fortran program rather than assuming the C++ example’s entry point is appropriate. Inspect the thread and frame that owns the state of interest before printing variables.
The Intel Distribution for GDB 2025 release notes describe capabilities and platform requirements. Native CPU debugging and debugging an offloaded kernel are different target paths. A successful host breakpoint does not establish device-debug support for an arbitrary accelerator backend.
Interpret optimized state as generated code
A variable marked optimized out is not proof of memory corruption. Its value may no longer have an independently addressable location at that point. Source lines can execute out of apparent order, and inlining can change the visible call stack.
Use the optimized executable’s symbols, assembly view and surrounding instruction sequence when source stepping becomes ambiguous. Compare the inputs to the relevant operation instead of insisting that every source variable remain inspectable. The GDB optimized-code guidance explains this distinction.
If a numerical difference appears, examine the language and floating-point contract as well as code generation. Preserve compiler diagnostics and the relevant optimization report when available. Reducing an optimization level is a useful experiment; it does not by itself establish a compiler defect.
Keep thread placement and runtime state reproducible
For OpenMP applications, record thread count, affinity policy and the runtime library loaded by the process. The same executable can behave differently when a batch system grants a different CPU set or another module adds a different runtime to the library path.
Inspect all thread stacks for a hang. Distinguish a thread doing useful computation, one waiting at a barrier and one blocked on I/O or a lock. A snapshot shows where each thread stopped, not necessarily which thread caused the delay. Take a second bounded observation if needed to determine whether progress continues.
When MPI is involved, reduce the run to the smallest reproducing rank configuration. Stopping one rank at a breakpoint can make the others wait normally in a collective; do not misreport that debugger-induced wait as the original deadlock. Use the site’s supported multi-process debugging workflow for the full case.
Use diagnostics that match the language
Fortran bounds and runtime-check facilities can help narrow indexing and argument errors, but their flags and coverage depend on compiler release and program features. Enable the documented checks deliberately and retain the exact build configuration.
For C++, investigate lifetime, bounds, aliasing and data-race assumptions with tools supported by that compiler/runtime combination. Do not assume a diagnostic build proves that an uninstrumented concurrent program is free of races. Keep an input-level regression test alongside any tool-specific result.
Avoid editing variable values in the debugger as evidence of a production fix. It can be useful for testing a hypothesis, but the final remedy must be expressed in source, build configuration or an identified runtime requirement that ordinary users receive.
Escalate with a reduced case and a comparison matrix
A useful compiler issue report includes source, exact flags, versions, target CPU assumptions and expected versus observed behavior. Show the smallest set of changes that switches the result, with the original input and correctness check retained.
Include successful and failing configurations without asserting that every difference is causal. If changing compiler, optimization, thread count and host simultaneously makes the issue disappear, the next task is separating those variables.
Validate the remedy under the original optimized configuration and normal allocation path. Then use Intel core, cache and memory analysis to examine performance. Debugging establishes a trustworthy computation; profiling determines which parts of that computation consume the available machine.