
Advanced Slurm job troubleshooting: memory, exit codes and missing evidence
Reconstruct a failed job across allocation and step records, application output, cgroup limits and node events, then design a small reproduction that distinguishes causes.
After a Slurm job fails, find the earliest error before increasing its memory and trying again. A worker exception, a memory kill, stalled storage and a wrapper that hid the return code can all leave similar scheduler records.
Preserve the failed run’s output, step records and node list. A larger-memory retry may succeed because the limit helped, because the input changed or because it ran on a different node. A small controlled reproduction can tell those possibilities apart.
The commands here use an illustrative job ID. They do not assume that a particular accounting field is populated on every cluster.
Read the allocation and its steps
Retrieve the parent job and child steps together:
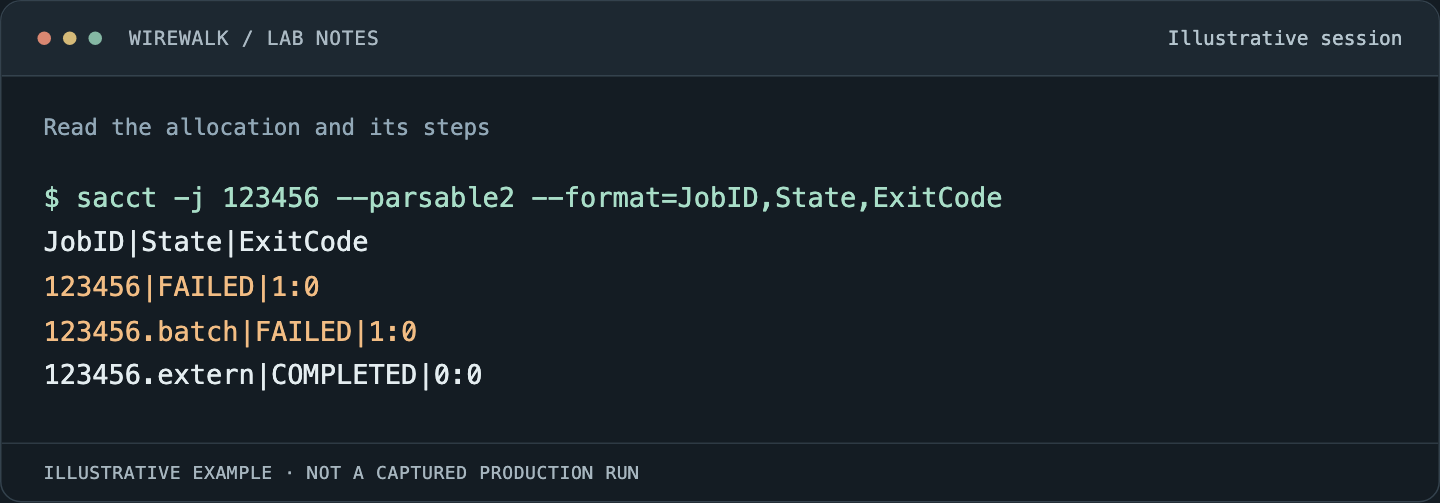
Read the illustrated session as text
$ sacct -j 123456 --parsable2 --format=JobID,State,ExitCode
JobID|State|ExitCode
123456|FAILED|1:0
123456.batch|FAILED|1:0
123456.extern|COMPLETED|0:0
Read and copy the original commands
job=123456
sacct -j "$job" --units=M --parsable2 \
  --format=JobID,JobName,State,ExitCode,DerivedExitCode,Elapsed,NodeList,ReqMem,MaxRSS,MaxRSSNode,MaxRSSTask
scontrol show job -dd "$job"
The controller may no longer retain an old job, while accounting still does. Record when each query was made. Avoid using sacct -X for the first diagnosis because hiding step records removes evidence about where the failure occurred.
Interpret an exit code alongside the command that produced it. Slurm reports exit and signal information, but a shell wrapper can convert a failed inner command into an apparently successful batch result. The sacct reference describes the job/step records and fields; it also notes that available statistics depend on the underlying collection mechanism.
Find the earliest meaningful failure
Build a short timeline from standard error, application logs, scheduler records and node events. Keep time zones explicit. The last line in a log often describes a consequence: another rank disappeared, a socket closed or a cleanup handler failed.
If the application reports a missing input before the MPI launcher reports lost ranks, investigate the missing input first. If the kernel records a memory kill before the application prints communication errors, those later errors may be secondary.
Preserve the submitted script, environment manifest, image digest, input version and node list. Record whether output was written per rank or merged. Buffered output can arrive late, so textual order across files is not an exact clock. Use application timestamps and system evidence where available.
Distinguish the three memory budgets
A GPU job commonly has at least three relevant memory domains: host RAM, GPU device memory and shared-memory or temporary-file capacity. An application can exhaust one while dashboards show free space in another.
A CUDA out-of-memory exception is not automatically a Slurm host-memory violation. A host cgroup limit can terminate a worker even when the GPU still has free memory. A data-loading subprocess can fail because a memory-backed filesystem is full while neither of those limits has been reached.
Write down which component allocated memory and which limit rejected it. Then compare that domain with the resource request. Increasing --mem does not increase physical GPU memory. Reducing GPU batch size may not fix an input pipeline that duplicates a large dataset into every CPU worker.
Interpret MaxRSS with its collection method
Do not compare a memory request directly with one unexplained MaxRSS number and declare the case solved. Examine the step, node and task associated with the value. A maximum is not necessarily the simultaneous total of every worker.
For cgroup v2, Slurm documents differences between cgroup memory accounting and process RSS, including cache treatment and unavailable virtual-memory metrics. Check the installed release’s cgroup v2 limitations. Sampling and configuration can affect whether brief peaks appear.
During a reproduction, use running-step data where supported:
sstat -a -j 123456 \
  --format=JobID,AveRSS,MaxRSS,MaxRSSNode,MaxRSSTask
The sstat documentation requires operational job-accounting collection. Missing values are a visibility limitation, not evidence that memory usage was zero.
Correlate kernel and cgroup evidence
An administrator should inspect a bounded time window on the affected node and the relevant job cgroup. The path must be discovered from the running process; do not hard-code a hierarchy copied from another Slurm version.
# Run with appropriate visibility on the affected node.
journalctl -k --since '2026-10-28 09:00:00' \
  --until '2026-10-28 09:15:00'
cat /proc/12345/cgroup
Here both the time window and PID are placeholders. For an identified cgroup v2 path, inspect its memory limit and event counters according to the kernel memory-controller documentation. Compare counter changes over the reproduction, not an unexplained lifetime total.
Distinguish a constrained workload reaching its limit from the whole node exhausting memory. The latter also calls for investigation of advertised memory, operating-system headroom, untracked processes and node services. Increasing one job’s limit can make a node-wide problem worse.
Make the wrapper preserve failure
A batch script should report the outcome of the actual application. For a simple single-step job:
#!/bin/bash
#SBATCH --job-name=bounded-reproduction
#SBATCH --ntasks=1
#SBATCH --cpus-per-task=4
#SBATCH --mem=8G
#SBATCH --time=00:10:00
set -euo pipefail
srun ./reproduce-case
This is a template requiring a real reviewed program. More complex workflows need deliberate handling of expected nonzero exits, pipelines, background workers and cleanup. A successful final echo must not erase the application’s failure. Conversely, a cleanup error should not hide the original cause.
When several steps run concurrently, explicitly wait for each and record their statuses. Capturing only the last background process leaves failures invisible. Shell strict mode helps with some mistakes, but it is not a substitute for designing the workflow’s success conditions.
Reduce the reproduction along useful dimensions
Hold the input and software identity constant, then reduce scale. Try one task, one node and a small representative input before repeating the full job. If the failure requires concurrency, increase that dimension in controlled steps.
For suspected memory growth, compare progress against consumption. A stable peak tied to batch size suggests a different remedy from memory that grows with every iteration. For irregular data, retain the exact failing sample or partition if policy permits it. A synthetic small input that omits the difficult case may produce a misleading clean run.
Only change one suspected cause per experiment. Save a small matrix of input, task count, thread count, memory request, node and outcome. That makes a successful run interpretable rather than merely fortunate.
Verify the scientific result as well as the process
A zero exit status is necessary for many workflows but insufficient for research correctness. Check output count, expected dimensions, checksums or application invariants. Partial outputs from an interrupted run can make a retry appear complete when some work was skipped.
Give the researcher the first failure found, the change made and the result of the reproduction. If only a workaround is known, say what it changes and what remains unexplained, so the next run does not begin with a false diagnosis.
Read next: A distributed Slurm job is running but making no progress: a debugging sequence, Node-local scratch under Slurm: stage data without losing the result.