
NVIDIA Run:ai for research: qualify the GPU platform before measuring utilization
Set up and qualify a Run:ai research platform through dependency checks, project policy, distributed jobs, storage recovery and monitoring that distinguishes allocation from progress.
A shared GPU platform should help researchers reach a useful result sooner. A busy-looking dashboard is only part of that story. Researchers also need predictable access to the right GPU, working datasets, a communication path between workers and a recoverable checkpoint when something fails.
Run:ai adds resource and workload management to Kubernetes. Qualification therefore needs to cover the platform’s policy decisions and the infrastructure that carries out those decisions. A workload can satisfy one layer and fail at the next.
The documentation baseline here is NVIDIA Run:ai self-hosted 2.22. This is a deployment and acceptance method, not a universal installation command for every Run:ai edition. SaaS, self-hosted, Kubernetes and OpenShift arrangements have different prerequisites; retain the selected release’s requirements with the installation record. The vendor lifecycle table places 2.22 within its full-support period at this article date. Use it as a reproducible reference, and choose the appropriate supported target for a new deployment.
Draw the control-plane and worker boundaries
Start with the proposed placement of the Run:ai control plane, cluster services, ingress, registries and GPU workers. Identify who owns DNS, TLS, identity integration, storage, monitoring and upgrades. Record which connections are required during installation and normal operation.
The 2.22 system requirements distinguish placement arrangements, including whether the first cluster and control plane share a Kubernetes cluster. Do not impose a separate ingress/FQDN requirement from another topology without checking the chosen arrangement.
Consider separating system-service placement from expensive GPU workers using the release’s supported configuration. Then test the available capacity during maintenance: a worker drain should not unexpectedly remove every service needed to schedule or observe the remaining workers.
Write down the supported Kubernetes, GPU Operator, driver and runtime combinations. Compatibility is a property of the selected stack. The existence of a newer operator image is not enough reason to replace the qualified one in the middle of an investigation.
Validate dependencies before registering the cluster
Qualify a basic GPU pod outside the Run:ai workload path. It should start, identify its assigned GPU and run a small computation. Next verify dataset access and checkpoint writes under the intended user and security context.
For distributed training, validate the secondary network and communication libraries separately. A successful one-node CUDA test does not establish RDMA connectivity, GPUDirect behavior or usable multi-node collective performance. The Kubernetes multi-rail guide provides that network acceptance sequence.
Check registry access from the nodes that actually pull images, including proxy and certificate trust. Check control-plane connectivity from the relevant services, rather than relying on a browser session on an administrator’s laptop. Time synchronization and TLS trust failures can otherwise look like registration or authentication problems.
The vendor’s cluster installation guide includes preinstall diagnostics. Review its permissions and behavior before running it: diagnostics may create test resources and are not simply a read-only inventory command. Run the selected diagnostic version in the approved environment and retain its result.
Install from the selected environment’s instructions
Use the installation instructions and registration material generated for the intended control plane and cluster. Store credentials through the approved secret-management process. Do not paste registration tokens into a public runbook, terminal recording or Git history.
Retain chart version, image digests, approved values and the nonsecret record of control-plane association. Inspect the rendered objects, node placement, storage and network dependencies before installation. An air-gapped installation also needs an artifact inventory and an upgrade route through the internal registry.
After deployment, inspect the real namespace and component state. For the conventional namespace, initial read-only checks are:
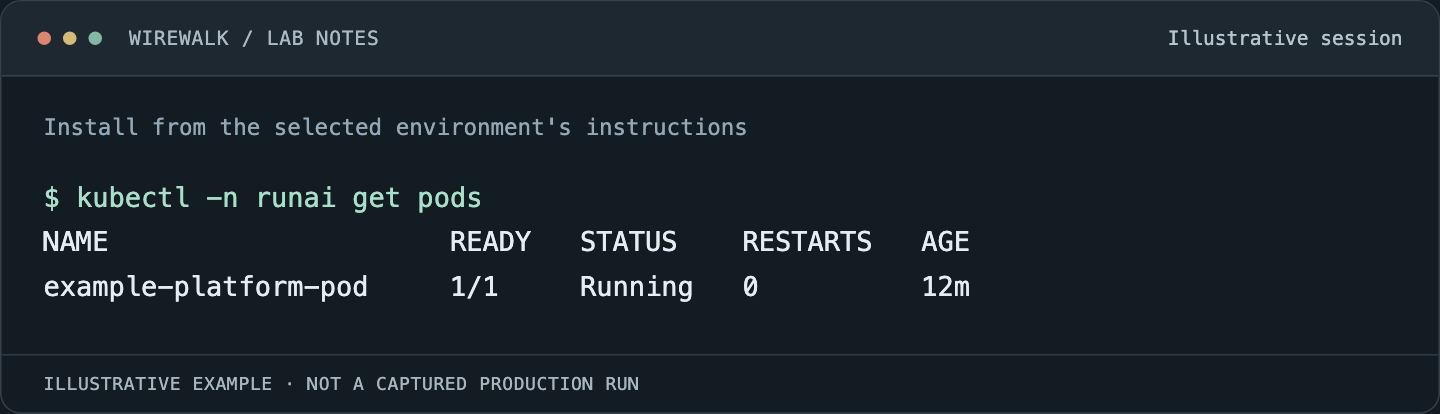
Read the illustrated session as text
$ kubectl -n runai get pods
NAME                     READY   STATUS    RESTARTS   AGE
example-platform-pod     1/1     Running   0          12m
Read and copy the original commands
kubectl -n runai get pods
kubectl -n runai get events --sort-by=.metadata.creationTimestamp
kubectl get nodes
Use the actual namespace if it differs. Select logs from the failing component and time window rather than dumping every configuration object. Configuration can contain operational details or secrets that do not belong in a general troubleshooting report.
Treat a successful Helm operation, a connected cluster and a successful research workload as three separate acceptance points. Preserve evidence for each.
Turn project policy into testable expectations
Create a small research project and document its resource entitlement, borrowing behavior, workload priority and relevant node-pool restrictions. Use two test users or projects to exercise the intended boundary rather than only testing as an administrator.
Submit a job that fits within the project’s allocation, then a controlled request that exceeds the intended limit. Record the expected queue or rejection behavior. Repeat with another project using capacity so that the test exercises contention, not merely an empty cluster.
Distinguish allocated resources from consumed resources. A job may reserve a GPU while waiting for storage or another worker. A project may have policy headroom while no compatible physical device is currently available.
If enabling fractional GPU use, qualify the actual sharing mechanism, memory behavior and isolation required by the workload. Fractional scheduling and MIG partitioning are not interchangeable descriptions. Test a representative memory-intensive job and a latency-sensitive neighbor before expanding sharing policy.
Troubleshoot the stage where progress stops
| Stage | Evidence | Questions to answer |
|---|---|---|
| Submission | User, project, workload definition and response | Is the request valid and permitted? |
| Admission | Workload state, policy and competing demand | Is it waiting for allocation, priority or an eligible pool? |
| Pod placement | Pod events and node resources | Do affinity, taints, CPU, memory and GPUs fit together? |
| Startup | Image, volume and container events | Can the image run and access its data? |
| Distributed initialization | Worker count, rendezvous and transport logs | Did every required rank start and connect? |
| Useful computation | Step time, input wait and device/fabric metrics | Which component limits progress? |
A quota increase does not fix a bad volume mount. A node added to the wrong pool may not help a constrained workload. Find the first unmet condition and preserve its reason before changing policy.
For distributed jobs, compare all workers. One container repeatedly restarting can make the surviving ranks look idle or hung. Capture the first failure, exit status and relevant Kubernetes events, then follow the failure into storage, image compatibility or network initialization as appropriate.
Monitor allocation, utilization and completed work together
The 2.22 metrics reference describes cluster, pool, project, workload and pod scopes. Distributed-workload observations can aggregate workers, so an aggregate chart should lead to a per-worker investigation when progress is uneven.
Build a view of submission-to-admission time, admission-to-running time and running-to-first-useful-step time. Add training step distributions, checkpoint duration and completion or restart outcome. These intervals tell a researcher more than a single utilization percentage.
Check metric freshness and collection health. A quiet chart may be stale rather than healthy. If the monitoring design forwards samples, observe its queues and failures alongside the receiving system. Validate the actual labels and series emitted by the installed release before importing alert rules.
Use GPU telemetry with job attribution, and keep physical capacity, policy entitlement and observed use distinct in reports. Avoid promising a utilization gain before measuring a representative workload mix and the researchers’ time to results.
Qualify interruption and upgrade behavior
Run a disposable checkpointed workload, interrupt an approved worker and test the documented recovery path. Confirm that a replacement can access the same dataset and that the application resumes from a complete checkpoint. The checkpoint recovery guide covers the storage checks behind that test.
Record the impact of policy changes and upgrades on pending and running workloads. Maintain a canary project that uses the same image, storage and network path as the research pool, with a bounded test duration and a clear expected result.
Keep the qualification record small enough to repeat after a driver, Kubernetes or Run:ai upgrade. That repeatable evidence is what turns a collection of GPU nodes into a service researchers can rely on. Wirewalk provides HPC and AI platform integration across these scheduler, GPU, network and storage boundaries.