
NVMe health and error logs: distinguish media wear, command failures and a broken path
Interpret NVMe SMART and error records with device identity, units and interval deltas, then connect them to kernel events and application-visible failures.
A rising NVMe error-log count can accompany a failing drive. It can also reflect rejected administrative commands while ordinary data I/O remains healthy. Replacing hardware on the strength of that one number can leave the actual software or path problem untouched.
Collect the device’s health information, detailed error records and host timeline together. Keep field scope and units intact. The useful question is which observation explains the application’s failure or the service risk you are trying to manage.
These examples follow nvme-cli 2.11-style commands and established standard log fields. Device-specific telemetry and newer command layouts require the documentation for the installed device and tool.
Preserve a baseline with identity and time
Capture model, serial number, firmware, subsystem and namespace context with each collection. Include the host boot identity and observation timestamp. A counter difference is meaningful only if both samples describe the same resource and the expected counter lifecycle.
Useful read-only snapshots include:
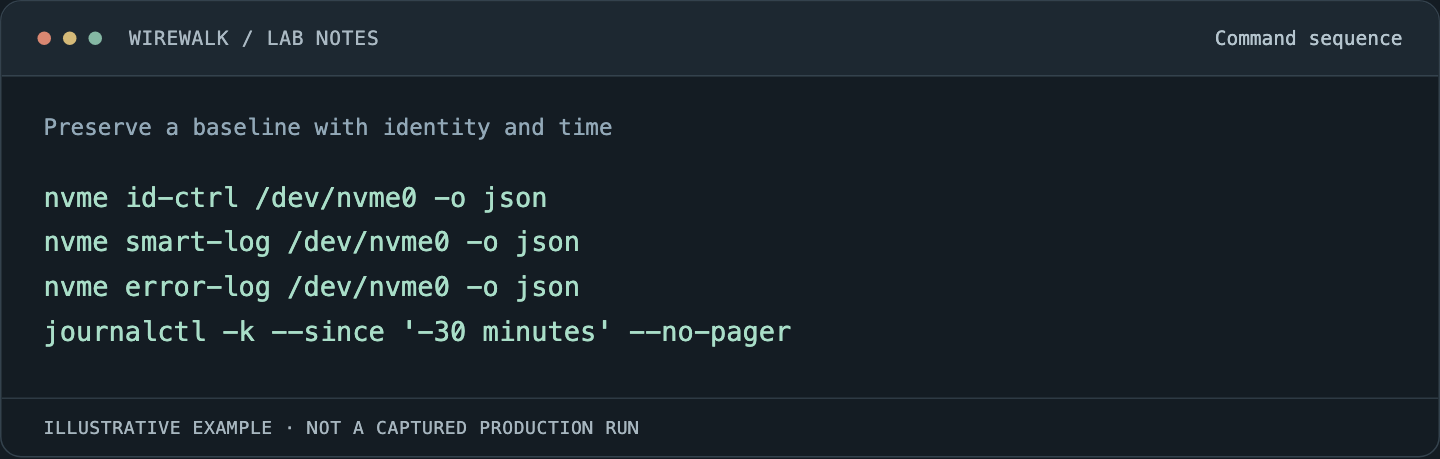
Read and copy the example as text
nvme id-ctrl /dev/nvme0 -o json
nvme smart-log /dev/nvme0 -o json
nvme error-log /dev/nvme0 -o json
journalctl -k --since '-30 minutes' --no-pager
Resolve the illustrative controller path before use. Log access requires appropriate permissions. Store kernel records privately where they contain workload paths or other infrastructure details.
The pinned SMART-log and error-log references describe the tool interfaces. Establish whether the requested health log is controller-wide or namespace-specific and whether that scope is supported. Opening a namespace block device should not be treated as proof that every returned counter belongs only to that namespace.
Read health fields according to their definition
Critical-warning bits, available spare, percentage used, media/data-integrity errors and unsafe-shutdown counts answer different questions. Keep the actual fields rather than collapsing them into one unsupported health score.
Percentage used is a vendor estimate of endurance consumption; it is not the probability that the next I/O will fail and can exceed 100. Available spare and its threshold concern another part of the device’s reported health. Neither field establishes the integrity of every file already stored.
The libnvme 1.11 field definitions provide a versioned reference for these established structures. Confirm vendor interpretation and supported reporting before building a fleet alert around a field that one device does not populate meaningfully.
Check how the tool renders temperature. Raw fields and human-readable output may use different representations. Preserve units in the monitoring pipeline instead of assuming that a bare JSON number is already Celsius.
Keep traffic units separate from physical NAND writes
Standard Data Units Read and Written use thousands of 512-byte units, with defined rounding. A single reported unit therefore represents 512,000 bytes at that reporting granularity, not one filesystem block.
Use interval differences with that scaling when estimating host traffic. Retain large integer values without rounding them through an imprecise intermediate representation. Mark resets, replacements and missing readings so a negative difference does not become negative write traffic.
Host-written data does not reveal the device’s internal physical write amplification by itself. A vendor-specific physical-media counter may provide additional information, but its definition and scope need separate validation. Do not divide two counters with different lifecycles and call the ratio a measured endurance property.
Investigate individual error records
Inspect the status information and relevant context in the detailed error log. Distinguish media/data-integrity errors from invalid commands, unsupported fields, aborted operations and transport-related symptoms where the available evidence supports that distinction.
A cumulative error-entry count is not a count of failed user reads. The detailed log has finite retention, and not every entry includes a useful timestamp or an application-level address. Capture it early in an incident, before routine collection or further errors obscure the relevant context.
Keep the first observed application error and kernel event. Later controller resets, reconnects or filesystem errors can be consequences rather than the original cause. Build a timeline instead of assigning equal causal weight to every line containing the device name.
Separate controller health from PCIe or fabric health
A controller can report acceptable health fields while its PCIe path suffers link problems or its remote transport is unstable. Conversely, a healthy transport cannot compensate for a media failure inside the device.
Correlate kernel timeout, reset, PCIe error and transport observations with the same interval. Record link topology and recent maintenance. Do not clear shared diagnostic counters merely to obtain a convenient zero baseline; use documented interval deltas where practical.
Check application demand and host pressure as well. A long latency tail can arise from queueing, thermal operating constraints, firmware behavior or an overloaded service. Low percentage-used does not exclude those explanations.
Make alerts reflect a supported operating decision
Separate immediate warnings from trends that support planned replacement. A new critical warning, recurring unrecovered integrity failures and slowly increasing endurance consumption deserve different actions and response times.
Include identity, firmware, field change, affected workloads and relevant logs in the alert. A responder should be able to tell whether the drive was replaced yesterday or whether a collector began requesting an unsupported log page.
Use vendor thresholds and the service’s redundancy and recovery requirements to decide the response. Avoid resetting a device or draining a whole fleet automatically because a single sampled value crossed an invented universal limit.
Verify the recovery with data and workload evidence
When replacing or isolating a device, preserve the last readable evidence and the supported recovery path. Determine which outputs can be trusted using application completion and integrity rules, not just the return of a mount point.
Re-run a bounded representative workload and inspect fresh interval counters afterward. A clean health snapshot immediately after reboot does not show that the original failure mode has been removed.
For paths that share one namespace, pair this investigation with NVMe multipath and ANA testing. For controller software changes, retain the same before-and-after evidence through firmware maintenance.