
Linux network CPU tuning: connect RSS, IRQ placement and NUMA to the workload
Investigate network CPU hotspots with queue and IRQ evidence, explicit ownership of affinity policy, and controlled tests that distinguish kernel packet processing from RDMA progress.
A node can show modest average CPU use while one core spends most of its time processing network traffic. A research job then waits on data, an input service slows down, or several flows contend for a receive queue while other cores remain quiet.
Start by finding the busy work and the path that created it. Queue count, interrupt distribution and application placement need to be understood together. Adding queues or moving interrupts without that map can move the bottleneck into a research rank or onto a remote memory path.
The Linux mechanisms below use kernel 6.12 documentation as a fixed reference. The available controls and counters depend on the NIC driver and distribution kernel. The examples collect state; actual tuning belongs in a qualified canary with a recorded rollback.
Identify which network path needs help
Separate ordinary kernel networking from userspace communication. Dataset access over a kernel TCP path, an application service and a verbs-based RDMA transfer can place different demands on the CPU.
RSS and the Linux packet-steering controls discussed here concern kernel networking work. They do not, by themselves, select an RDMA device for an MPI rank or prove how a userspace completion queue is progressed. Investigate the application’s communication layer separately when that is the relevant path.
For a GPU training job, measure whether the delay is in data loading, host preparation, host-to-device transfer or communication between workers. A network tuning change that improves an isolated TCP benchmark may leave the actual collective path unchanged.
Use the data-loader investigation to locate input stalls and the UCX transport guide for userspace communication selection.
Inventory queue, interrupt and CPU topology
Record the NIC’s PCI address, NUMA association, driver and firmware, queue configuration and the CPUs assigned to application work. Identify physical cores and SMT siblings rather than treating every logical CPU number as independent capacity.
Illustrative read-only checks are:
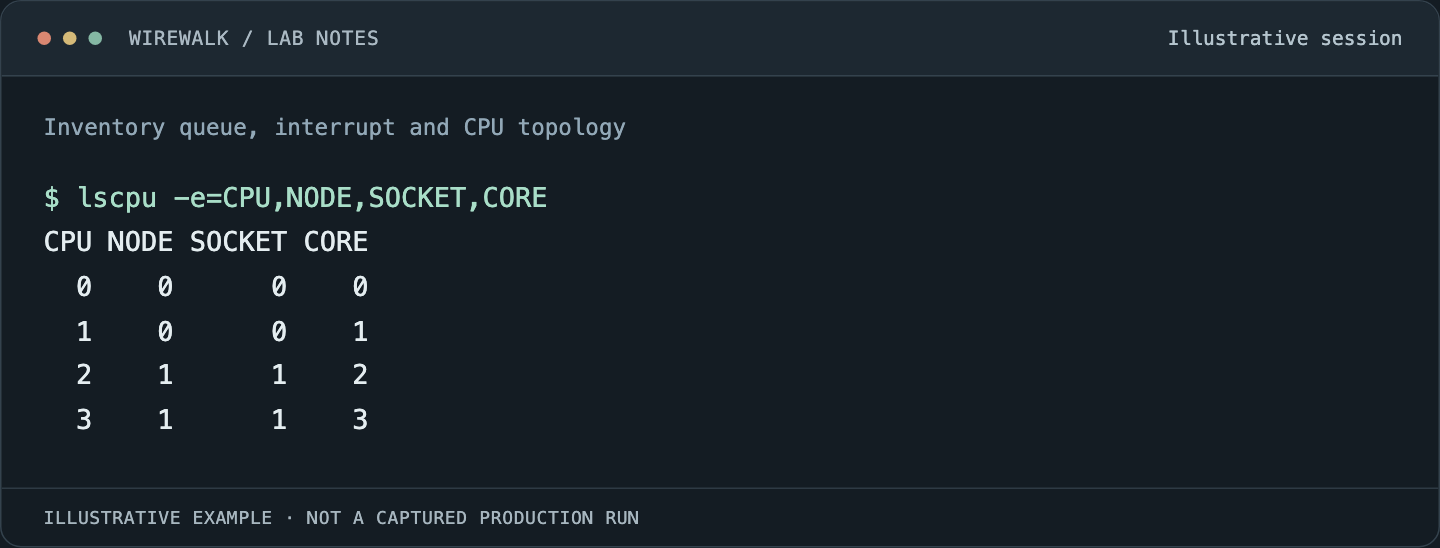
Read the illustrated session as text
$ lscpu -e=CPU,NODE,SOCKET,CORE
CPU NODE SOCKET CORE
  0    0      0    0
  1    0      0    1
  2    1      1    2
  3    1      1    3
Read and copy the original commands
netdev=example0
ethtool -i "$netdev"
ethtool -l "$netdev"
ethtool -x "$netdev"
ethtool -S "$netdev"
lscpu -e=CPU,NODE,SOCKET,CORE
cat /proc/interrupts
cat /proc/softirqs
Replace example0 with the verified interface. A driver may not implement every query. Preserve that result and its version context instead of substituting a guessed default.
Collect the whole mapping before selecting a few counters. Queue names and interrupt labels can change after a driver reload or channel-count change. A hardcoded IRQ number from last week’s image can refer to different work today.
Give each scaling mechanism a specific job
The kernel 6.12 networking-scaling guide describes RSS, RPS, RFS and XPS. Keep their roles distinct:
| Mechanism | Main decision it influences |
|---|---|
| RSS | NIC distribution of received traffic among hardware queues |
| IRQ affinity | CPUs permitted to handle an interrupt source |
| RPS | Software steering of receive processing to CPUs |
| RFS | Receive processing placement informed by application activity |
| XPS | Transmit-queue selection associated with CPU placement |
A receive flow may remain concentrated on one queue even when many queues exist. Queue count does not imply that a single connection will use all of them. Compare single-flow and multi-flow behavior before deciding that an uneven distribution is a configuration fault.
Increasing software steering also introduces work. Test whether an additional handoff helps the specific workload instead of enabling every mechanism because each promises scaling in isolation.
Choose an owner for CPU and interrupt placement
Record whether irqbalance, a provisioning system, a platform agent or a site policy manages interrupt placement. A manual setting that later changes may be the expected action of its owner, rather than evidence that the kernel ignored it.
Keep interrupt policy aligned with scheduler CPU reservations. Low-latency ranks, data-loader workers and network processing can compete when pinned to the same cores. Moving network work to a supposedly idle core can also hurt a workload if that core is a sibling of a busy application thread.
The IRQ-affinity reference describes smp_affinity and smp_affinity_list as permitted CPU targets. For a discovered IRQ, inspect the current list and any effective-affinity information exposed by the kernel:
irq_number=142
cat "/proc/irq/$irq_number/smp_affinity_list"
The IRQ number is an illustration, not a NIC-discovery method. Validate the association before using it. Keep desired policy, requested affinity and observed CPU activity as separate evidence.
Persist a tested policy through its normal owner. Confirm it after a reboot, driver update and node reimage, since those events can change queue enumeration or restore defaults.
Run a canary that can explain the result
Choose a representative host pair and a bounded workload. Fix process placement, dataset location, message sizes, flow count and duration. Record a quiet baseline before adding competing work.
Measure per-core CPU time and interrupt/softirq deltas over the same interval as useful throughput and latency. System-wide averages can hide a saturated core; cumulative counters can hide whether it was active during this particular test.
Change one element: a supported queue configuration, RSS mapping or affinity policy. Re-run the identical workload and observe neighboring work as well. A higher throughput number is not an improvement if a latency-sensitive research service now misses its operating target.
Do not assume that the NIC’s nearest CPU is always the correct application CPU. Account for where application memory is allocated, where data is prepared and the contention already present on that NUMA domain.
Diagnose the remaining hotspot
If one queue remains busy, first determine whether the test supplies one flow or a sufficiently varied set of flows. Inspect the RSS mapping and selected protocol before changing CPU masks again.
If receive processing is distributed but the application remains slow, inspect socket handling, application locks, storage input and memory placement. Networking may have stopped being the bottleneck.
If CPU overhead rises after enabling more steering, compare context, cache and handoff costs. Keep the original configuration available so the test can be reversed without rebuilding the node.
If an RDMA workload behaves differently from a TCP test, collect the userspace communication configuration, rank binding and completion/progress behavior. Avoid treating an evenly spread /proc/softirqs view as proof that GPU-to-GPU transfers are using the intended path.
For congestion under load with healthy CPU placement, continue with RoCE ECN/PFC investigation. For inconsistent device locality, verify the PCIe topology and link state first.
Monitor policy drift and research outcomes
Store the qualified queue and CPU mapping with the platform configuration. Monitor changes in device identity, driver, channel layout, affinity owner and the CPU reservations expected by the scheduler.
Use interval rates with explicit reset handling. Driver statistics are not interchangeable across devices, and several counters may describe different stages of the same packet loss. Preserve raw values and counter definitions when investigating a new driver release.
Report the result in workload terms: data delivered to the application, time spent waiting for input, communication latency and completed research work. Keep the test’s flow count and concurrency beside those measurements so another administrator can reproduce the conclusion.
A useful tuning record says which work moved, which bottleneck changed and what happened to the application. It gives the next operator a measured policy to preserve rather than an unexplained collection of CPU masks.