
DCGM monitoring: connect GPU telemetry to the job that produced it
Build a GPU monitoring pipeline that preserves device identity, sampling meaning and job boundaries, then handles unsupported or missing values honestly.
A graph showing a busy GPU is useful only if you can identify the device, the time interval and the work that used it. Otherwise a researcher can be charged with another job’s activity, or an administrator can investigate a utilization drop that was actually a monitoring gap.
NVIDIA DCGM supplies device telemetry, health and profiling facilities. The surrounding monitoring system must preserve their meaning as samples travel through an exporter, time-series database and dashboard. This article concentrates on that data contract rather than choosing an attractive set of panels.
Give every measurement an identity and a clock
Keep the physical GPU UUID, node identity and collector identity with the sample. A device index such as GPU 0 is convenient within a running node, but it is not a durable fleet-wide identifier. Record inventory changes so a replacement accelerator is not silently merged with the history of the device it replaced.
For MIG, retain both the parent GPU and instance identity when the installed stack exposes them. Treat layout recreation as an inventory change. Historical attribution must not assume that an instance number always refers to the same resource.
Separate observation time from ingestion time. If a collector buffers samples while its network path is unavailable, later ingestion does not make those samples current. Track scrape health and sample age alongside device measurements. Use synchronized clocks and retain enough timing information to recognize uncertainty around allocation boundaries.
Choose a small set of questions first
Start with the operational questions: is a device missing, is a job making progress, is temperature or power constraining behavior, and are errors increasing? Then decide which supported fields can help answer each question.
Do not enable every profiling field merely because the exporter can list it. Check hardware and software support, permissions, collection cost and compatibility between metric groups. Unsupported data needs an explicit unavailable state, not a numeric zero that looks like a healthy idle device.
The archived DCGM 3.1 feature overview provides a useful reference for the established distinction between health, telemetry and profiling. Match the field semantics to the version actually installed rather than assuming a current field catalog applies to an older host engine.
Correlate with allocation intervals
Build a timeline of which job owned each device and when. Use scheduler allocation events or a supported integration that maintains that mapping. Usernames, current process lists and the latest allocation snapshot are not adequate historical records on their own.
At a job boundary, a monitoring interval can overlap two owners. Decide how the pipeline handles that interval: exclude it from per-job summaries, mark it as mixed, or use a documented attribution method. A precise-looking decimal does not fix an ambiguous boundary.
For shared GPUs, distinguish physical-device measurements from measurements that can actually be attributed to an instance or process. Assigning a whole-device power reading independently to every sharing job double-counts the same observation. A model for distributing shared cost is an accounting policy and should be labeled as such.
Keep sampling and aggregation explicit
A one-second sample and a five-minute average can tell different stories. Short stalls disappear inside long windows; low-frequency sampling can miss brief bursts. Retain the collection interval and the aggregation rule in the dashboard description.
When comparing two runs, align the phases. Startup, data loading, training, validation and checkpointing can have very different device behavior. Compare a representative steady-state interval as well as end-to-end elapsed time. Averaging the entire allocation can hide whether a faster training loop was offset by a slower input stage.
For counters, handle resets before calculating rates. A negative difference after a node reboot is not negative traffic. Preserve restart and inventory events so the pipeline can break the series at a meaningful point. For gauges, do not sum values across time unless the units and desired quantity justify that operation.
Validate the pipeline with known behavior
Use a qualified node and a small controlled workload. Observe an idle interval, a compute-heavy phase, a transfer phase and application shutdown. Confirm that expected samples arrive with the right device and time labels. The goal is validating the pipeline, not claiming that one synthetic load reproduces production training.
Inspect the raw exporter output and stored series before debugging the graph. A dashboard can display the wrong unit perfectly. Check for stale label mappings, duplicate collectors and multiple series representing the same device.
Read-only inventory commands help establish the reference:
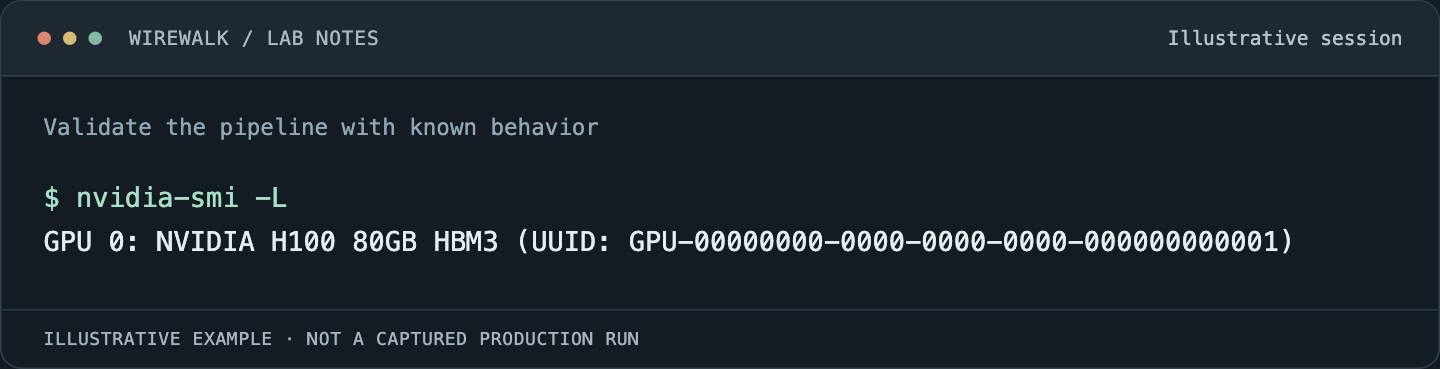
Read the illustrated session as text
$ nvidia-smi -L
GPU 0: NVIDIA H100 80GB HBM3 (UUID: GPU-00000000-0000-0000-0000-000000000001)
Read and copy the original commands
nvidia-smi -L
dcgmi discovery -l
dcgmi --version
These do not authorize active diagnostics on a busy node. Keep potentially intrusive tests in a maintenance allocation and use the installed DCGM documentation to understand their scope.
Coordinate profiling ownership
A developer profiler and continuous monitoring can contend for hardware-counter resources. Establish how a profiling session is requested, what collection is paused where required, and how monitoring is restored. A global monitoring change should not be hidden inside an individual user’s shell setup.
Record intentional gaps as maintenance events. Otherwise the monitoring team may treat the absence as a collector failure, while the application team assumes the metric means no work occurred. Test that the normal collection path returns after the profiling session exits unsuccessfully as well as after success.
Make alerts require enough evidence to act
Alert on sustained, attributable conditions with a useful response. A missing GPU, repeated error growth or a collector that stopped reporting may justify different owners and urgency. Do not automatically drain a node because one utilization sample is low.
Attach the device identity, interval, relevant job mapping and recent inventory events to the alert. A responder should be able to distinguish a hardware problem from an exporter restart without rebuilding the timeline manually.
Use GPU utilization and useful work alongside this monitoring contract. Reliable telemetry can tell you what the device was doing; application progress is still needed to decide whether the research benefited.